At MOO we have had tracing for a long time. This was based on a solution created in house before the likes of Jaeger and OpenZipkin were made widely available. And arguably met the same requirements at the time. However, like most home grown tools, the people who built it moved on and the support and even the use of it started to dwindle to where some of the newer developers didn’t even realise tracing was supported at the company.
When the ask for tracing support surged recently, we realised our under invested in tool was just not the right fit anymore so we went on a hunt for what we could move to. We identified kind of 3 categories of tools…the magic promise to do everything for you for the cost of your first born child tool(™️), the open source tracing tool, and then the new dark horse observability tool. We evaluated at least one tool in each category and realised that when balancing developmental, operational and cash costs we picked the dark horse option of Honeycomb. While Honeycomb can support a lot more, it also supported our tracing needs right now and we were excited for what we could do to grow into more interesting use cases.
So now it has been a few months and just like anything else, we have not grown in a clear linear path. We have access…mostly everyone has signed in at least once. We have tracing…in at least what used to have tracing plus a few more services. We have…a couple…big wins with more interesting use cases.
So now we are looking at how to make sure everyone at the company comes on the journey into the new and exciting world. While the previous statements were setting the scene and pretty steeped in clear facts, the next few things are just my personal findings about our experience and what I think has helped us.
While we have some interesting wins using features like bubble up, it seems that focusing on getting pretty stock standard tracing has been a good way to build experience with the UI, conversations around how communications across crews will work via their data interactions, and what our observability language and norms will be. Below are a couple of things that I have noticed in our experience that has helped with onboarding and upskilling.
One, two, many
When introducing a new use case for the data, get it working in a big impact service first. In our case, we added deployment markers for our monolith (recently made into a pretty bad ass one too!). This means that when a new deployment goes out to production, we can tell so if something goes wrong, we can also see if it correlates with a deployment.
This helped us clearly identify when one of our servers did not provision correctly after a deployment and we saw an introduction of 400 errors. In this case it was a provisioning issue (with starting up tomcat) and not a software issue, so it was limited to a single host and therefore not visible in the bottom graph since the count of errors was quite small in comparison to our traffic.

Then one of our teams saw these and thought it was great! So they introduced markers for their application too.
And as we saw people picking up this awesome opportunity to gain insights, we also saw how the world would look if EVERY deployment was marked given the high number of services and deploys we do every day.

Getting to good here is in part learning best practices like changing colours depending on the app, deciding what deploys need a marker etc. And part waiting for the feature request to only show certain markers rather than all or nothing.
But in either case, starting by introducing an example of a feature without having to have it sorted out at scale yet generated a level of conversation I just don’t think we would have had if it were around a planning whiteboard.
Work in bursts
Tracing can appear like a magical image of what is happening in your system. It is a bit like all of a sudden joining Ms Frizzle’s class and taking the magical school bus to see what actually happens when someone clicks a button on your website. But in reality is is just a bit of grunt work to make each and every service conform to some simple communication rules. In our case we need every service to send a header with its request that says what the overarching trace id is, what its own id is, and if there is any specific data that it wants to be known by any of its children. What this does is allow every request that gets that header to know what bucket it falls in (trace id) and how it is organised within the bucket (the other id is it’s parent). Well there is a reason for the Tower of Babel story, communication can be hard and we ran into that.
We had traces that only showed our CDN level. A CDN (or Content Delivery Network) is a common tool used by websites to allow for protecting the application from unnecessary load and decreasing response time in locations around the world through caching pages and content that can then be served from a server closer to the person requesting it and without needing to ever touch our internal servers. In the case of the trace below though, it says the cache status was “PASS” in Fastly which means it did need to be responded to by our internal services yet we don’t see any listed below the initial CDN trace.

We had traces that started without any indication of the users request via our CDN.

We had traces that knew their bucket, but didn’t have parents so didn’t know how they fit together.

These were all frustrating situations because we could see how close things were but they were just not lining up. I mean…it is an age old tale of integrations and we definitely (re)learned how much more valuable taking 4 developers and working for 1 day all together is instead of taking 4 developers and each working for 1 day. This is important to call out though because a part of our pitch to leadership for bringing in a new tool included an estimate of time taken from developers. We had an agreement on general hours spent but were free to do with them as we pleased. While we would have preferred a hackathon right from the beginning, this wasn’t feasible early on due to product backlog constraints. But when we got to the end of the nitty gritty, that was the absolute best way to get across the line.
Build the boarder first
I am a big puzzler. I love em. And any good puzzler knows that by building the border first you can completely transform your expectations (unless you are doing a liberty puzzle…then all rules out the window!). All of a sudden the table space needed is way (usually) more than you actually need and you start to question how the heck all those pieces are going to fit in that frame?!
We decided to trial the same theory with tracing. If we had our border span which is from the CDN request to it’s response, then we would know that any unaccounted for time was a missing span. Since every single request to our website is first serviced by Fastly where it can be evaluated for special localisation treatment, possible cached response opportunities, or of course, to be sent through to our backend services.
This tracking from a single entry point for all requests to our site has worked wonders and we now have two major scenarios where we start asking questions about coverage.
The first is visible in the trace below. In this trace we can see our CDN and it says our request took 4.99s. In looking at the specific start stamps I can see that it took 29ms to get from Fastly to our internal service “site”. Then it took 8ms to get to the second internal service “render” and then 2ms to get a request to “template” service. All of these times seem reasonable as direct parent-child relationships. But then we spend 4.847 seconds living in the unknown. Does render have a call to another service? is it calling a DB? Is it just doing a really time intensive activity? We don’t know but we sure as heck want to look into it now!

The other big place we are asking questions is when we see time between spans. In the following trace we see what looks like the same type of request. It moves from our CDN to our internal service called site and then off to render and template. But there is a very big difference here. Instead of the request moving from Fastly to site in 29ms, it took 1.01s. This is a huge difference! When it was we could chalk it up to network speed. And that may be the case at in this second trace too. It also was a lot more time on the backend. Instead of the site span taking up 4.941 of the 4.990 seconds (99%), it was only 1.719 of the 3.44s (~50%). Given we have a couple of routing layers in there we all of a sudden need more visibility into their behaviour.
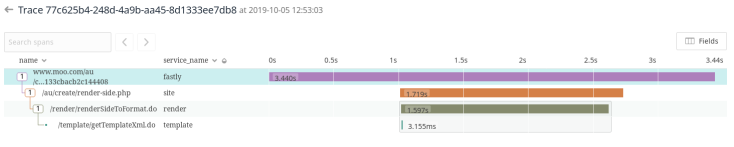

Getting the borders of our CDN request in has helped us spot this gap. Had we not had Fastly tracing, we would never know that the 2nd trace was any different than the first as they both have very similar internal service duration (4.99s vs 3.44s) and hit all the same services.
Wrap up
These are not meant to be “the right way”, just a reflection back on what has made the biggest impact in our first couple of months using a new tool for understanding our systems. Can’t wait to see where we go next!

[…] Baby steps into tracing Written by: Abby Bangser […]
LikeLike